Of all the numbers in glucose monitoring, fasting glucose gets the most attention. It is the first test your doctor orders. It is the number used to diagnose prediabetes. And it is the reading that causes the most confusion when it comes back higher than expected.
Here is what your fasting number actually tells you, and the important things it does not.
What the Number Means
Fasting glucose measures your blood sugar after at least 8 hours without food, typically first thing in the morning. It reflects your liver's overnight glucose production and your body's baseline insulin sensitivity.
The diagnostic thresholds, established by the American Diabetes Association and WHO, are:
- 99 mg/dL or below - Normal
- 100 to 125 mg/dL - Prediabetes (impaired fasting glucose)
- 126 mg/dL or above - Diabetes range
These categories are not cliffs. A fasting reading of 101 is not dramatically different from 99. What matters far more than any single reading is the trend over weeks and months. A fasting average that drifts from 95 to 105 to 112 over six months tells a story that a single measurement cannot.
The Dawn Phenomenon: Why Your Morning Number Might Be Misleading
Here is something that surprises many people: your fasting glucose can be elevated even when you ate well the night before and slept soundly. The reason is a natural hormonal process called the dawn phenomenon.
Between roughly 3 AM and 8 AM, your body releases a surge of hormones - cortisol, growth hormone, glucagon - that signal the liver to release stored glucose. This prepares your body for waking activity. In people without diabetes, the pancreas releases enough insulin to keep glucose steady during this process. In people with prediabetes or diabetes, the insulin response may not fully compensate.
The result: morning glucose elevated by 10 to 40 mg/dL above what it would be at, say, 2 AM.
Research shows that the dawn phenomenon affects more than 50% of people with diabetes, and it is common in prediabetes as well. It can shift a reading from "normal" to "prediabetic" range through no fault of your own diet or behaviour.
This does not mean the reading is wrong. It means the reading reflects your body's hormonal regulation as well as your metabolic health. Understanding this distinction changes how you interpret the number.
What a Single Fasting Reading Cannot Tell You
Fasting glucose is valuable, but it has real limitations:
It misses post-meal spikes. You could have a perfectly normal fasting glucose of 92 mg/dL and still spike to 185 mg/dL after a meal of white rice. Post-meal glucose excursions are an independent cardiovascular risk factor, and fasting glucose does not capture them at all.
It varies day to day. Even under identical conditions - same dinner, same sleep, same stress level - fasting glucose can vary by 5 to 15 mg/dL from one morning to the next. This is normal biological variation, not a sign of worsening health. A single high reading is not a diagnosis; a consistent pattern of high readings is.
It does not reflect glucose stability. Two people can have the same fasting glucose of 108 mg/dL, but one swings between 70 and 180 throughout the day while the other stays between 90 and 130. Their fasting numbers are identical, but their metabolic health is very different. Glucose variability, measured by metrics like CV (Coefficient of Variation), captures what fasting glucose alone cannot.
What Matters More Than Any Single Number
The trend is more important than the reading.
A fasting glucose that has been 98, 97, 95, 93 over the past four weeks tells you something powerful: your interventions are working. A reading that has been 102, 106, 110, 115 tells you something equally important: something needs to change.
This is why tracking fasting glucose over time - not just at your annual checkup - transforms it from a static diagnosis into a dynamic feedback tool.
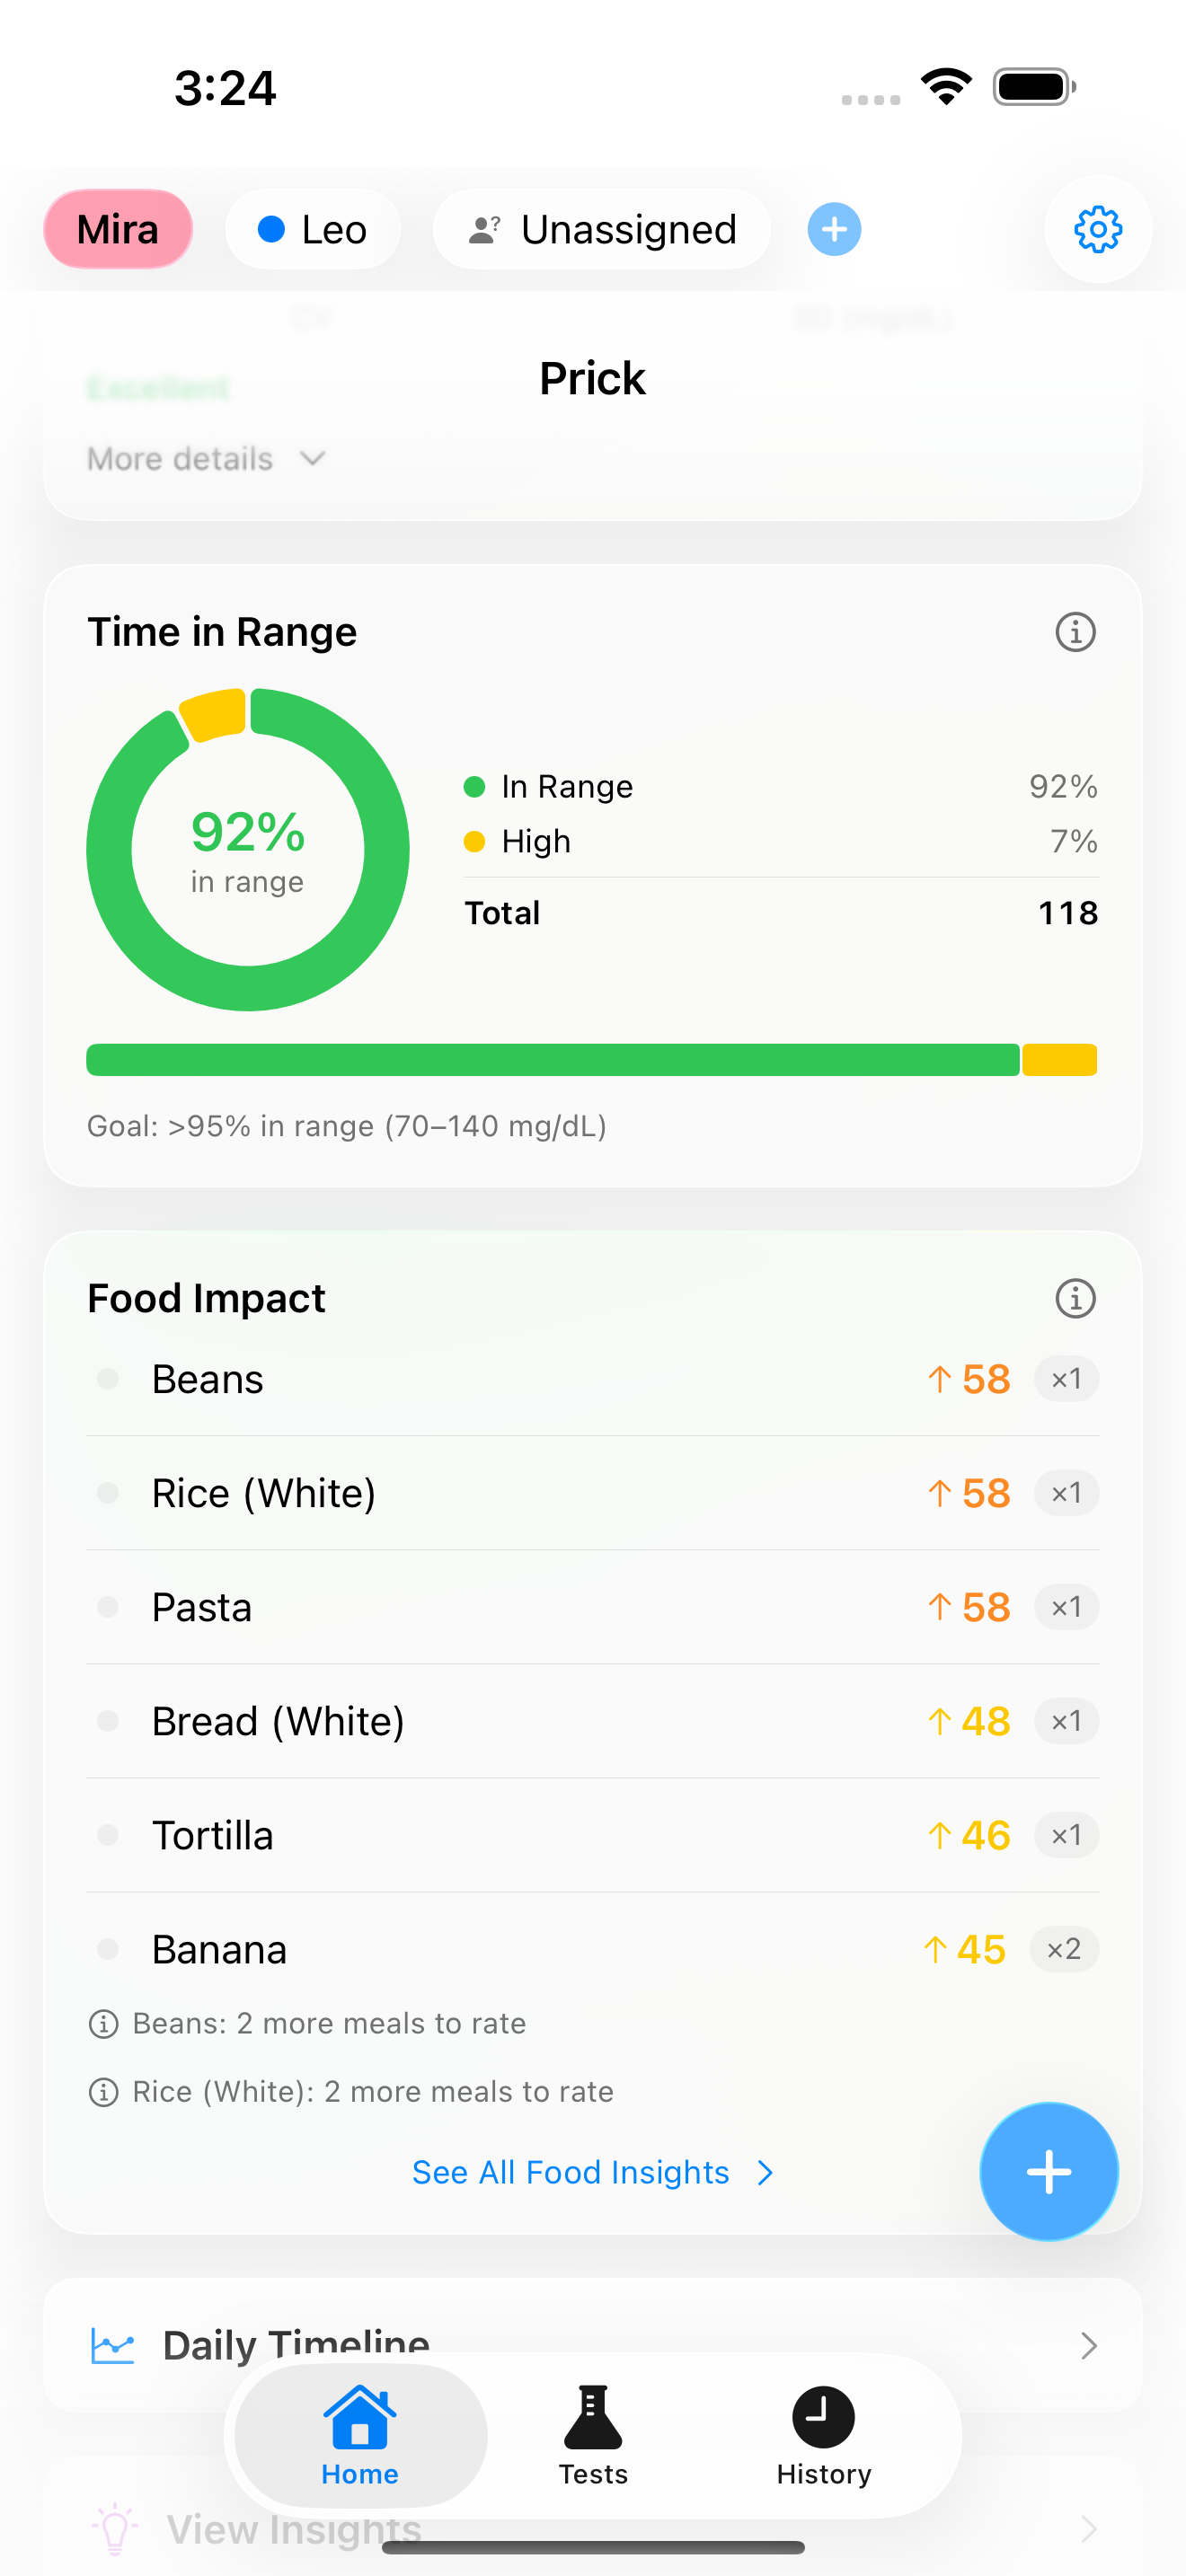
How Prick Helps
Prick tracks your fasting glucose over 7, 14, and 30-day windows and shows a trend arrow indicating whether your readings are rising, falling, or stable. A difference of more than 5 mg/dL between your 3-day and 7-day fasting average triggers a direction indicator, so you can see shifts early.
The app also detects the dawn phenomenon by comparing your bedtime readings to your morning readings. If your glucose consistently rises overnight by more than 10 mg/dL across 3 or more paired readings, Prick flags this as a detected dawn phenomenon pattern. This distinction matters because a dawn-driven elevation requires different strategies (such as an evening walk or adjusted dinner composition) than a generally elevated baseline.
Your fasting number is the starting point for understanding your glucose health. But it is the trend, the variability, and the full daily picture that give you the information you need to act on.
Based on: ADA Standards of Care 2023 (Diagnostic Thresholds); Circadian Disruption Research; Dawn Phenomenon Studies
View full citations
- American Diabetes Association. "Classification and Diagnosis of Diabetes: Standards of Medical Care in Diabetes." Diabetes Care. 2023;46(Suppl 1):S19-S40. https://doi.org/10.2337/dc23-S002
- Monnier L, et al. "The Loss of Postprandial Glycemic Control Precedes Stepwise Deterioration of Fasting With Worsening Diabetes." Diabetes Care. 2007;30(2):263-269. https://doi.org/10.2337/dc06-1612
- Carroll MF, Schade DS. "The Dawn Phenomenon Revisited: Implications for Diabetes Therapy." Endocrine Practice. 2005;11(1):55-64. https://doi.org/10.4158/EP.11.1.55
- Reutrakul S, Van Cauter E. "Sleep Influences on Obesity, Insulin Resistance, and Risk of Type 2 Diabetes." Metabolism. 2018;84:56-66. https://doi.org/10.1016/j.metabol.2018.02.010
