You have been tracking your glucose for weeks. You have dozens of readings, trend data, meal tags, experiment results. You know which foods spike you, how walking helps, what your fasting trend looks like. But when you sit across from your doctor, how do you communicate all of this effectively?
Doctors are busy. A typical outpatient consultation in India lasts 10-15 minutes. Your doctor cannot read through 60 glucose readings or scroll through weeks of app data on your phone screen. What they need is a structured summary that answers their clinical questions in under two minutes.
That is exactly what Prick's AGP report is designed to provide.
What Your Doctor Needs to See
When a doctor evaluates glucose control, they are asking specific clinical questions:
- What is the average glucose and estimated HbA1c? This tells them overall control quality.
- How much time is spent in range? This reveals whether the average is being pulled down by lows or maintained by consistent in-range readings.
- How variable is glucose? Two patients with the same average glucose have different risk profiles if one is stable and the other swings wildly.
- What is the daily pattern? When are the peaks? Is there a dawn phenomenon? Are post-meal readings the main problem?
- Is glucose improving or worsening over time? The trend matters more than any single snapshot.
- Is the data reliable? How many readings? How many days? Are there enough data points to draw conclusions?
A glucose notebook with handwritten numbers answers some of these questions but requires the doctor to do the analysis mentally. A structured report answers all of them at a glance.
The AGP Report Format
AGP stands for Ambulatory Glucose Profile. It is the clinical standard for presenting glucose data to healthcare providers. Originally developed for continuous glucose monitoring in 1987, the format has been adopted by the American Diabetes Association and endorsed by international consensus as the preferred way to share glucose data.
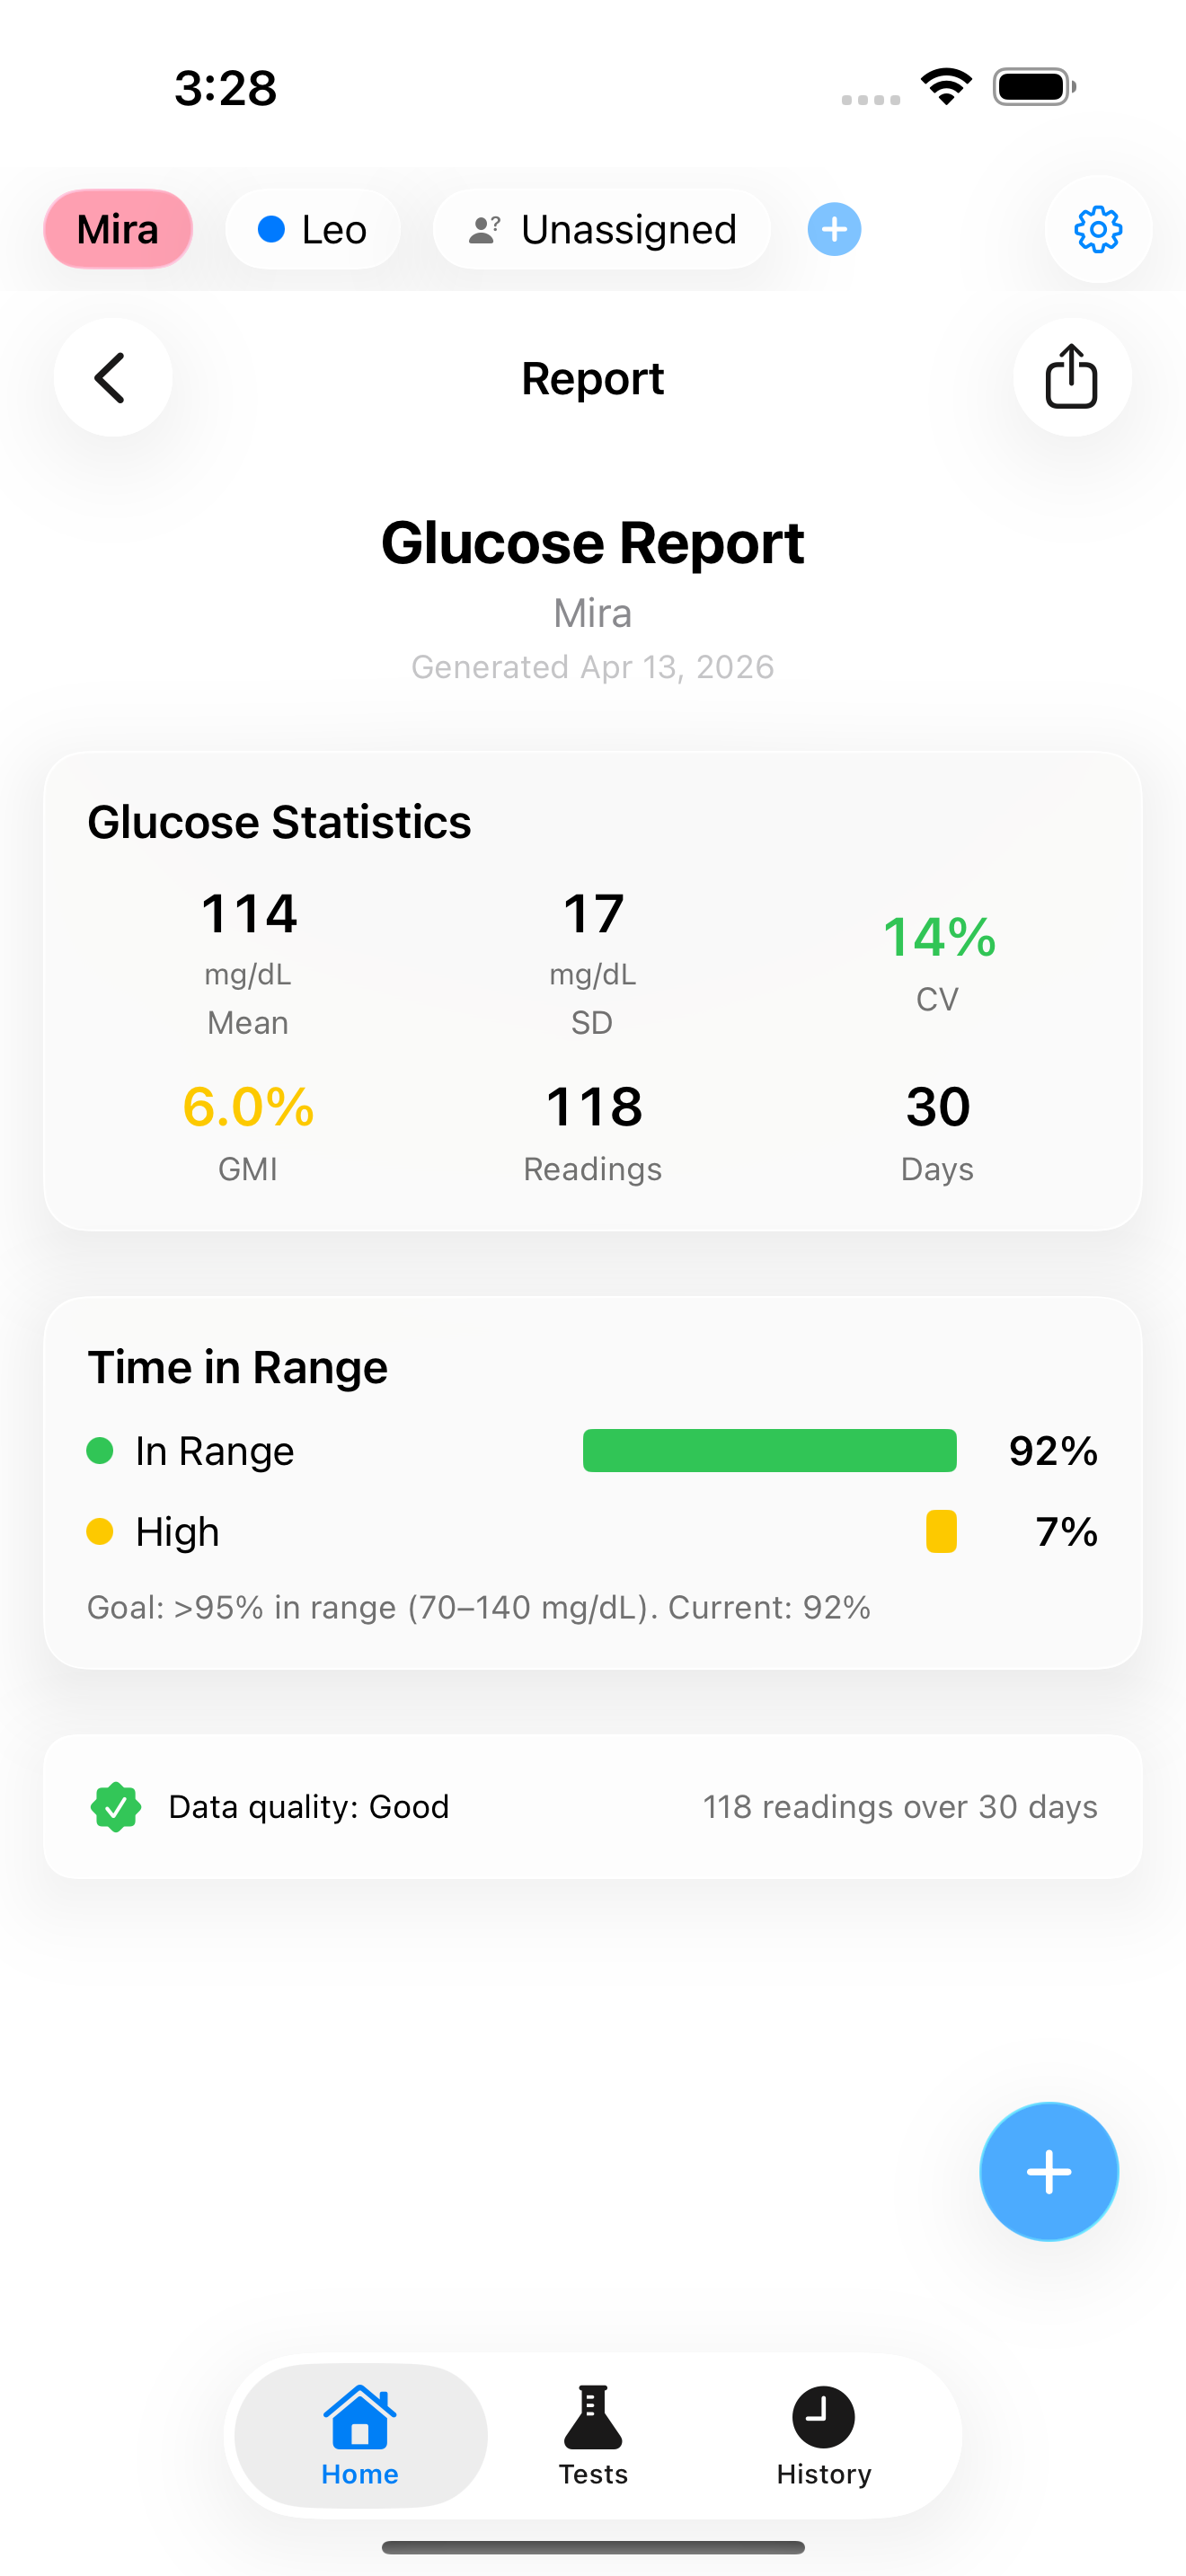
Prick generates an AGP-style report adapted for fingerstick (SMBG) data. The report is a single page designed to be read in under two minutes. Here is what it contains:
Header section: Your name, the date range of the data, the number of days monitored, and the number of readings. This immediately tells your doctor whether the data is sufficient to draw conclusions.
Summary statistics box: The key numbers your doctor looks for first:
- Mean glucose - your average across all readings
- GMI (estimated HbA1c) - the formula-based estimate of what your lab test would show
- Time in Range (TIR) - the percentage of readings in the 70-140 mg/dL target zone for prediabetes
- Coefficient of Variation (CV) - how stable your readings are
These four numbers, presented together, give your doctor an immediate clinical picture. A mean glucose of 115 with a CV of 22% and TIR of 88% tells a very different story from a mean of 115 with a CV of 40% and TIR of 65%.
Time distribution breakdown: A visual showing the percentage of readings in each glucose zone: Very Low (below 54), Low (54-70), In Range (70-140), High (140-180), and Very High (above 180). This is displayed as a stacked bar chart with colour coding: green for in-range, yellow for borderline zones, red for high/low zones.
Trend direction: Whether your fasting glucose and overall glucose are improving, stable, or worsening over the reporting period. Your doctor can see at a glance if your current management strategy is working.
Data quality indicator: The report includes an assessment of whether the data is sufficient for reliable conclusions. More readings spread across different times of day produce more reliable metrics. If you only have fasting readings, the report notes this limitation honestly.
How to Share the Report
Prick generates the report as a PDF that you can share directly from your phone:
Email it before your appointment. Send the PDF to your doctor's clinic a day or two before your visit. This gives them time to review it at their convenience and come to the appointment with specific questions or recommendations.
Print it. If your doctor's office prefers paper, print the single-page PDF and bring it. The report is designed to be readable in black and white, though colour printing is better.
Show it on your phone. If you did not prepare in advance, you can generate and show the report during the appointment. The PDF format ensures consistent formatting regardless of screen size.
Making the Most of Your Appointment
The report is the starting point, not the entire conversation. Here are practical tips for using your glucose data productively with your doctor:
Highlight what you have tried. "I started walking after dinner three weeks ago. The report covers the period before and during that change. My fasting trend dropped from 118 to 108." This gives your doctor context that the numbers alone do not show.
Ask about specific patterns. "My fasting glucose is consistently 10-15 mg/dL higher after poor sleep. Is that something we should address?" Specific, data-backed questions get more useful answers than general "how am I doing?" inquiries.
Discuss what is not working. "I have been consistent with diet and walks for six weeks, and my GMI is steady at 6.2% instead of improving. Should we consider medication?" Data makes this conversation objective rather than emotional.
Ask about your personal targets. Your doctor may want to adjust the targets the app uses based on your specific health situation, age, and other conditions. The report's thresholds are based on international consensus for prediabetes, but your doctor may have reasons to personalise them.
What Makes Good Data
The quality of the report depends on the quality of your data. Here are the factors that make your data most useful to your doctor:
Test at different times. Fasting readings alone give an incomplete picture. Post-meal readings, bedtime readings, and occasional random readings paint a fuller picture. Aim for a mix.
Tag your meals. When the report shows your average spike by food type, your doctor can make specific dietary recommendations rather than generic "eat less carbs" advice.
Be consistent. Two weeks of daily testing produces better data than two months of sporadic testing. Your doctor needs enough data points at consistent times to identify genuine patterns versus random variation.
Include context. The notes you add about sleep quality, stress, walks, and medication timing are not on the PDF report, but they are in the app. If your doctor wants to dig deeper, you can show them the daily timeline on your phone.
Minimum for a useful report: Aim for at least 14 days of data with 2-3 readings per day. This gives enough data points for reliable GMI, TIR, and variability calculations. The data quality indicator on the report will tell you whether your data meets this threshold.
Beyond the Report: The Insights Hub
For doctor visits where you want to go deeper, Prick's Insights hub contains additional analytics that are relevant to clinical discussions:
Risk assessment: LBGI (Low Blood Glucose Index) and HBGI (High Blood Glucose Index) quantify your specific risk of hypoglycemia and hyperglycemia. The GRI (Glycemia Risk Index) combines both into a single composite score. These are the metrics researchers and endocrinologists use in clinical trials.
Glucose heatmap: A visual showing which hours of which days have the highest glucose. If your doctor is trying to determine whether medication is needed and when to schedule it, this pattern information is invaluable.
Dawn phenomenon detection: The app automatically detects whether your morning readings are elevated relative to your bedtime readings, which is relevant for medication decisions and treatment planning.
The Key Takeaway
Your glucose data is only as valuable as your ability to communicate it. A shoebox of test strips or a scroll of numbers on a phone screen does not help your doctor make better decisions. A structured, one-page AGP report with summary statistics, trend information, and time-in-range breakdown answers every clinical question in under two minutes.
Generate the report before your appointment. Share it in advance if possible. Come prepared with specific questions based on what the data shows. Your doctor will appreciate the clarity, and you will get more personalised, actionable advice.
The best appointments happen when both you and your doctor are looking at the same data, speaking the same language.
Based on: AGP report standards; Bergenstal RM et al. (2018), GMI; Battelino et al. (2019), TIR consensus; Klonoff et al. (2022), GRI
View full citations
- Bergenstal RM, et al. "Glucose Management Indicator (GMI): A New Term for Estimating A1C From Continuous Glucose Monitoring." Diabetes Care. 2018;41(11):2275-2280. https://doi.org/10.2337/dc18-1581
- Battelino T, et al. "Clinical Targets for Continuous Glucose Monitoring Data Interpretation: Recommendations From the International Consensus on Time in Range." Diabetes Care. 2019;42(8):1593-1603. https://doi.org/10.2337/dci19-0028
- Mazze RS, et al. "Ambulatory Glucose Profile: Representation of Verified Self-Monitored Blood Glucose Data." Diabetes Care. 1987;10(1):111-117. https://doi.org/10.2337/diacare.10.1.111
- Klonoff DC, et al. "A Glycemia Risk Index (GRI) of Hypoglycemia and Hyperglycemia for Continuous Glucose Monitoring Validated by Clinician Ratings." Journal of Diabetes Science and Technology. 2023;17(5):1226-1240. https://doi.org/10.1177/19322968221085273
