Prick's dashboard shows a lot of information. Each card is there because it tells you something specific about your glucose control. But numbers without context are just numbers. This guide walks through every element on the dashboard, explains what it means, and tells you what to do about it.
Think of this as the user manual for your glucose data.
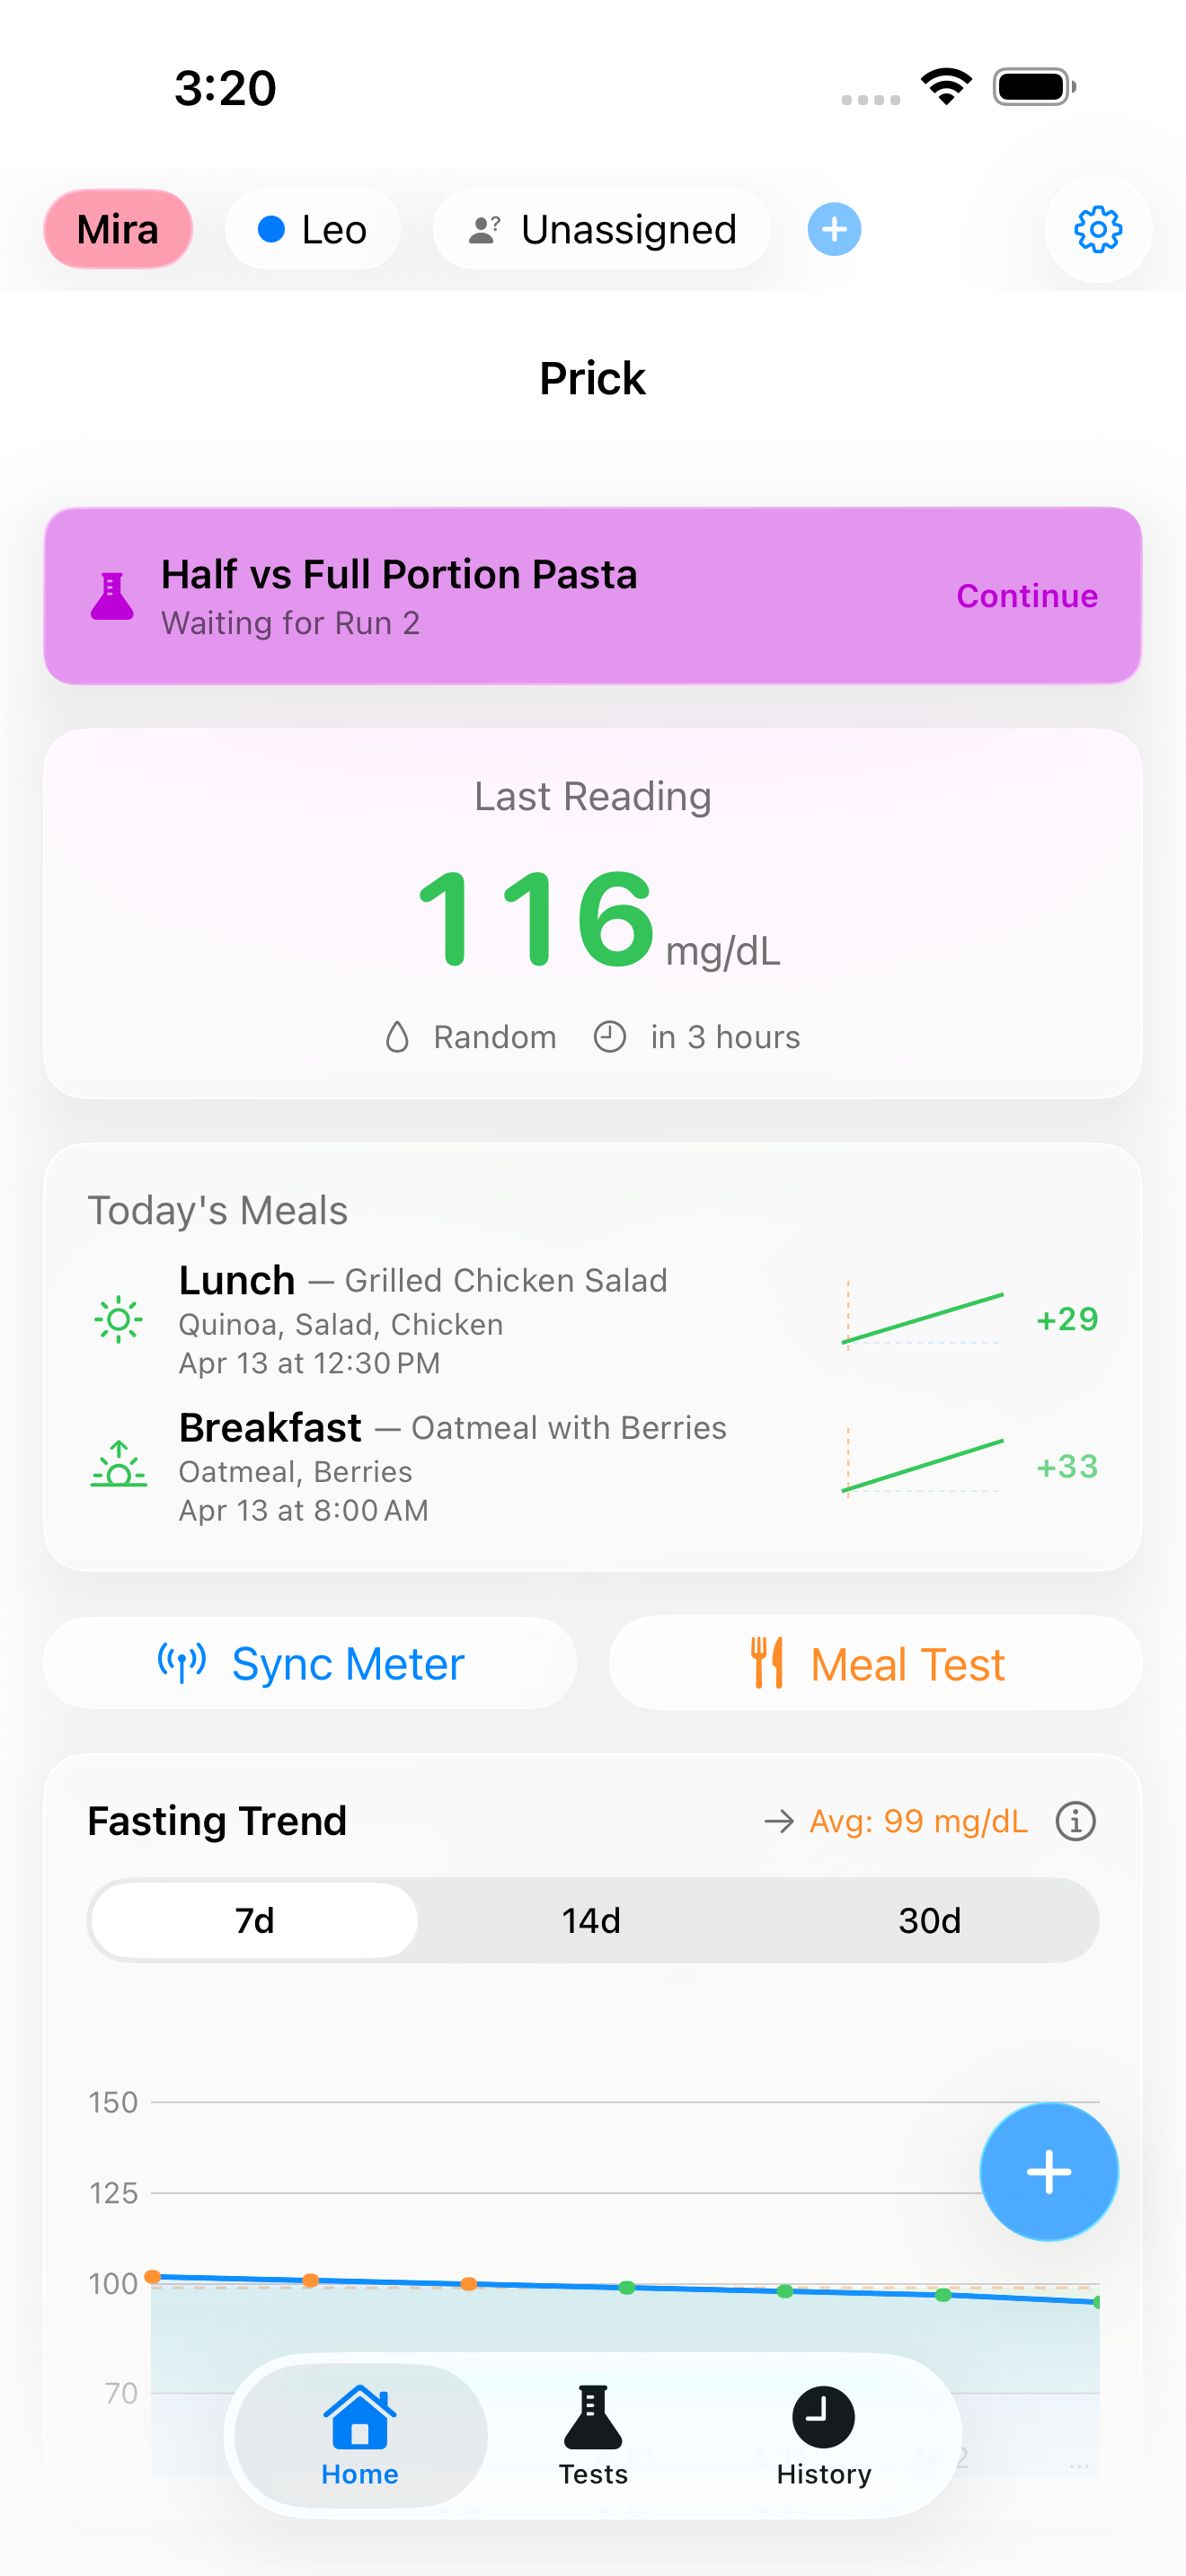
Last Reading Card
The first thing you see at the top of the dashboard is your most recent glucose reading. It shows the value in mg/dL, when it was taken, and a colour-coded label indicating where it falls.
The labels and what they mean:
- "In Range" (Normal): Your reading is within the healthy range for that measurement type. For fasting readings, this means below 100 mg/dL. For post-meal readings, below 140 mg/dL.
- "Above Target" (Prediabetic range): Your reading is in the zone that indicates prediabetes. For fasting, this is 100-125 mg/dL. For post-meal, 140-199 mg/dL.
- "High" (Diabetic range): Your reading exceeds 125 mg/dL fasting or 200 mg/dL post-meal.
- "Low" (Hypoglycemia): Your reading is below 70 mg/dL. This is uncommon in people not on insulin but should be taken seriously.
What to do: The last reading is a snapshot, not a trend. A single high reading is not cause for alarm. Look at the trend cards below to understand the bigger picture.
Today's Meals
This section shows the meals you have logged today, with their food tags and the glucose spike each meal produced. The spike is calculated as the difference between your post-meal reading and your pre-meal reading.
The spike thresholds:
- Below 30 mg/dL: Ideal. This meal was well-tolerated by your body.
- 30-40 mg/dL: Good. Your glucose rose moderately and is well within healthy bounds.
- 40-50 mg/dL: Acceptable. This meal caused a noticeable spike but not a concerning one.
- 50-60 mg/dL: Warning. This spike is larger than optimal. Consider changing the portion, composition, or order of this meal.
- Above 60 mg/dL: High. This meal caused a significant glucose spike. Review what you ate and consider testing alternatives.
What to do: If a meal consistently produces spikes above 50 mg/dL, use the experiment feature to test modifications: smaller portions, different pairings, eating vegetables first, or adding a post-meal walk.
Fasting Trend Chart
This is one of the most important cards on your dashboard. It shows your fasting glucose average over 7, 14, or 30 days, with a trend arrow indicating direction.
The trend arrow:
- Downward arrow (improving): Your 3-day fasting average is more than 5 mg/dL below your 7-day average. Your control is getting better.
- Horizontal arrow (stable): Your 3-day and 7-day averages are within 5 mg/dL of each other. Your control is steady.
- Upward arrow (worsening): Your 3-day average is more than 5 mg/dL above your 7-day average. Something has changed. Review sleep, stress, diet, and activity.
The fasting glucose targets:
- Below 100 mg/dL: Normal. This is the goal.
- 100-125 mg/dL: Prediabetic range. Lifestyle changes can bring this down.
- Above 125 mg/dL: Diabetic range. Discuss with your doctor.
What to do: Tap the help button next to the fasting trend for detailed guidance. If your trend is rising, look at the past few days: did your sleep change? Did you skip evening walks? Did meal timing shift later? The trend often responds to specific, identifiable changes.
GMI Card (Estimated HbA1c)
GMI stands for Glucose Management Indicator. It estimates what your HbA1c lab test result would likely be, based on the glucose readings stored in the app.
The formula: GMI = 3.31 + (0.02392 x average glucose in mg/dL)
For example, if your average glucose is 115 mg/dL: GMI = 3.31 + (0.02392 x 115) = 6.06%
The thresholds:
- Below 5.7%: Normal range.
- 5.7% to 6.4%: Prediabetic range. This is where you want to be moving downward.
- 6.5% and above: Diabetic range.
The progress bar: If you have fewer than 14 days of glucose data, the GMI card shows a progress bar instead of a value. GMI needs at least 14 days of readings to produce a reliable estimate. The bar fills as you add readings, showing how close you are to having enough data.
What to do: GMI is an estimate, not a diagnosis. It correlates closely with laboratory HbA1c but can differ by 0.3-0.5% in some individuals. Use it to track direction: is your estimated HbA1c going up, staying steady, or coming down? A drop of 0.5% in GMI corresponds roughly to an average glucose reduction of about 20 mg/dL.
Glucose Stability Card (CV and SD)
This card tells you how consistent your glucose readings are, not just whether they are high or low. Two people with the same average glucose can have very different health outcomes if one has stable readings and the other has wide swings.
Coefficient of Variation (CV): This is the primary stability metric. It is calculated as (Standard Deviation / Mean Glucose) x 100%.
- Below 25%: Excellent stability. Your glucose is very consistent.
- 25-30%: Good stability. Your control is steady.
- 30-36%: Moderate variability. Some instability worth monitoring.
- Above 36%: High variability. This is associated with increased cardiovascular risk and diabetic complications, independent of your average glucose.
Standard Deviation (SD): This is the absolute spread of your readings in mg/dL.
- Below 20 mg/dL: Excellent.
- 20-30 mg/dL: Good.
- 30-40 mg/dL: Moderate.
- Above 40 mg/dL: High spread.
Expandable section: Tapping "More details" reveals MAGE (Mean Amplitude of Glycemic Excursions) and MODD (Mean of Daily Differences). MAGE measures the size of your within-day glucose swings. MODD measures how consistent your glucose pattern is from one day to the next. These are advanced variability metrics that provide additional context.
What to do: If your CV is above 36%, focus on stabilising your meals and activity rather than just lowering your average. Consistent eating times, consistent meal composition, regular activity, and good sleep all reduce variability. Sometimes the best path to lower average glucose is through higher consistency.
Time in Range Card
This card shows what percentage of your readings fall within the target range for prediabetes: 70 to 140 mg/dL. It is displayed as a donut chart and a stacked bar.
The glucose zones:
- Very Low (below 54 mg/dL): Critical hypoglycemia. Rare without insulin therapy but always take seriously.
- Low (54-70 mg/dL): Below target. Alert zone for hypoglycemia.
- In Range (70-140 mg/dL): This is where you want to be. The prediabetes target is narrower than the standard diabetes range of 70-180 mg/dL.
- High (140-180 mg/dL): Above the prediabetes target but below the diabetes threshold.
- Very High (above 180 mg/dL): Sustained readings here indicate significant hyperglycemia.
Your target: Above 95% Time in Range for the 70-140 mg/dL zone. This is ambitious but achievable with consistent lifestyle management. Above 70% is acceptable if lifestyle changes are ongoing.
What to do: If your TIR is below 70%, look at which zone is taking the most share. If readings are predominantly in the 140-180 range, dietary modifications and post-meal walks will help. If readings are spread widely, focus on consistency first.
Food Impact Card
This card shows your average glucose spike by food tag. If you have been tagging your meals with specific foods (rice, dal, dosa, idli, etc.), this card ranks them by how much they spike your glucose.
What to do: Use this card to identify your personal problem foods and your safe foods. If rice consistently produces a 55 mg/dL spike while roti produces 30, that is actionable information. You do not need to eliminate the higher-spiking food - but you know which meals need extra help (smaller portions, dal pairing, post-meal walk).
Insights Link
This link appears once you have at least 10 readings. It opens the Insights hub, which contains advanced analytics: a glucose heatmap (showing which hours and days are problematic), risk assessment (LBGI and HBGI scores plus the composite GRI score), variability deep dives, dawn phenomenon detection, exercise correlation, and progression risk assessment.
These are deeper analytics for when you want to understand patterns beyond what the dashboard summary shows.
Recent Readings
The bottom of the dashboard shows your last 5 readings with timestamps, values, and context. This gives you a quick reference for recent activity without opening the full history.
The Dashboard as a Whole
Each card answers a different question:
- Last Reading: Where am I right now?
- Today's Meals: How did my meals go today?
- Fasting Trend: Where am I heading?
- GMI: What would my lab result likely show?
- Glucose Stability: How consistent am I?
- Time in Range: How much time do I spend in the healthy zone?
- Food Impact: Which foods cause the biggest spikes?
Together, they give you a complete picture. A rising fasting trend with high variability tells a different story from a rising fasting trend with low variability. A good GMI with poor Time in Range suggests that some readings are very low, pulling down the average while high readings are still too frequent.
The dashboard is designed to be read at a glance for the essentials and explored in depth when you want to understand more. Start with the trend arrow and the GMI. If both are stable or improving, your management is working. If either is worsening, the other cards will help you identify where to focus.
Based on: Bergenstal et al. (2018), GMI; Battelino et al. (2019), TIR consensus; Kovatchev et al. (1997), risk indices; international consensus on glucose variability metrics
View full citations
- Bergenstal RM, et al. "Glucose Management Indicator (GMI): A New Term for Estimating A1C From Continuous Glucose Monitoring." Diabetes Care. 2018;41(11):2275-2280. https://doi.org/10.2337/dc18-1581
- Battelino T, et al. "Clinical Targets for Continuous Glucose Monitoring Data Interpretation: Recommendations From the International Consensus on Time in Range." Diabetes Care. 2019;42(8):1593-1603. https://doi.org/10.2337/dci19-0028
- Kovatchev BP, et al. "Symmetrization of the Blood Glucose Measurement Scale and Its Applications." Diabetes Care. 1997;20(11):1655-1658. https://doi.org/10.2337/diacare.20.11.1655
- Service FJ, et al. "Mean Amplitude of Glycemic Excursions, a Measure of Diabetic Instability." Diabetes. 1970;19(9):644-655. https://doi.org/10.2337/diab.19.9.644
- Danne T, et al. "International Consensus on Use of Continuous Glucose Monitoring." Diabetes Care. 2017;40(12):1631-1640. https://doi.org/10.2337/dc17-1600
